
Flying Fish
Guests answered short questions to redeem, and the answers built a profile of who drinks it.
Service 05 · Software
We measure every impression, interaction and conversion and show it in one place, so you can prove what worked.
For brands, agencies and venues

End to end
Follow one guest from the screen in the venue to your dashboard. At every step we count something, say how sure we are of it, and send it to Hello Brand OS.

Brand Box plays your campaign on the venue's own screens, next to the sport guests came to watch.
Where it comes from: Brand Box play logs, pod.ai and Lamp.ai devices in the venue (supplied with Moving Tactics), and the audience model for that kind of place.

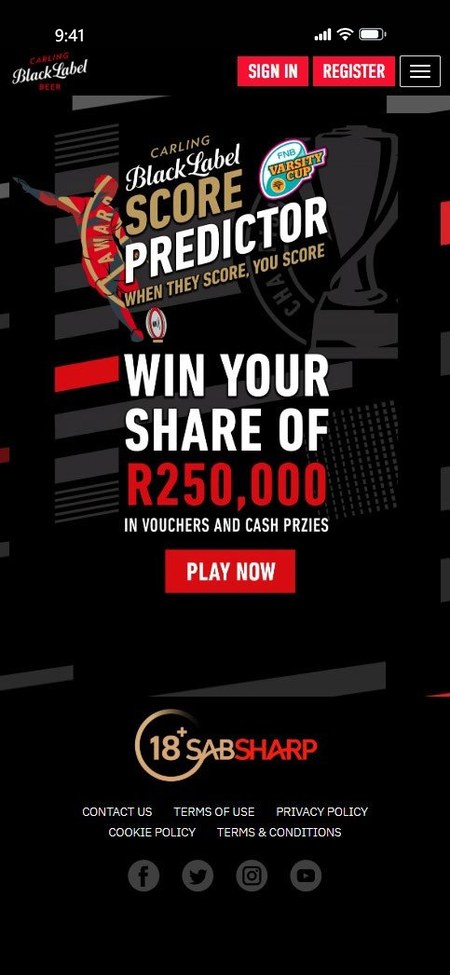
A code on the screen opens the campaign in the phone's browser, with no app to download.
Where it comes from: the campaign itself. Consent is recorded at sign-up and travels with the data, under POPIA.


Rewards are redeemed at the bar or the till, and outlet sales are matched to the campaign dates.
Where it comes from: reward codes scanned at the bar, till slips, and the outlets' sales before, during and after the campaign.
Everything above lands on one dashboard in Hello Brand OS, by venue and by week, while the campaign runs.
How sure each figure is: Estimated Modelled Measured Verified What the labels mean
Hello Brand OS
Brands, agencies and venues look at the same live results, each from their side. These are real dashboards from our venue platform.


Your brand across every venue and campaign: who saw it, who took part and what it sold.
For brandsThe same live view, ready to report to your client. We deliver; you keep the client.
For agenciesFootfall, dwell time and what each campaign brought in, venue by venue.
For venuesSeen in Carling Black Label
Seen in Jameson Carling Black Label Budweiser
Seen in Carling Black Label Jose Cuervo Heineken Vuse
Seen in Carling Black Label


Proof of what worked: who took part and what it was worth, venue by venue.
Our platform doesn't just track, it proves. First-party data comes from the people who take part, with their consent, under POPIA. Where a figure is an estimate, the report says so.
Four steps take a campaign from raw data to a decision about the next one.
First-party data from our CRM and mobile platforms, synced across retail, digital and in-store touchpoints, with consent kept.
Closed-loop sales tracking and consistent metrics: return on ad spend, lift and dwell time.
Games and experiential media on the phone, in venues and in store.
Online and offline data joined up, so results can be attributed across platforms.
Two kinds of data, joined up: what people tell us when they take part, and what the places around a screen tell us about who passes by.

Joined up in one place, with consent kept and people counted in groups.
Sign-ups, game plays, answers and redemptions from our mobile campaigns, across venues, shops and phones. Collected with consent and managed under POPIA.
Audience signals from location data, traffic and on-site sensors, used to plan and measure media. Anonymised and counted in groups, never as named people.
In the venue, pod.ai and Lamp.ai devices, supplied with Moving Tactics, add footfall and dwell-time data to Hello Brand OS: how many people are present and for how long, not who they are.
| Source | What it tells us | Where it falls short |
|---|---|---|
| Mobile app location data | Which places people visit, so we can group them into audiences and estimate age and gender. It also spots repeat visitors. | Fewer signals at roadside and highway sites, and it depends on how many people carry smartphones. |
| Live traffic | The best count of how many pass a site, using lanes, road type, direction, vehicle types and how many people are in each vehicle. | On its own, it says nothing about who those people are. |
| On-site sensors | Counts at the exact spot: new and repeat visitors, how long they stay and how close they come. Some models also count people and vehicles by camera. | Placed at chosen sites, so they are used mainly to check and tune the model for each kind of place. |
| Social posts | Age and gender, from public posts tagged at that location. | Depends on how many people tag their location there. |
No single source is perfect. So the model first works out what kind of place a screen is in, such as a mall, a busy road or a station, then weights each source for that kind of place. Census, survey and traffic reports act as a check.
Raw signals are not results. Each number in a report goes through three steps.
We collect the signals around each site, within about 200 metres, for every hour of the campaign.
We remove repeat signals that do not mean a real chance to see the advert, so nothing is counted twice.
The sources are combined with the weighting for that kind of place, then turned into reach, views, frequency and audience profiles.
Why cleaning matters. Someone has dinner for two hours at a restaurant with a screen outside. Raw location data would count their phone again and again. Cleaning sees that the phone is not moving and caps the count, so the report does not inflate the audience.
Each site's audience from the last three months predicts who will be there on your dates.
Audience data for each site, date and time band is refreshed daily, so we can adjust while the campaign runs.
Five days after the campaign ends: reach, ad spend, engagement across channels, redemptions and sales, plus proof that it ran.
What worked, where and when goes into the next plan, so each campaign starts smarter than the last.
The same terms, used the same way, in every plan and every report.
A campaign runs for five days. One person walks past the screen once every day.
We mix numbers with what people say, so you see whether the advert was noticed and whether it worked.
Whether the advert was actually seen: how much of it was in view, and for how long.
How people interact with it: taps, swipes, scans and other signs of active attention.
How long people spend with the advert, which shows how deep their attention went.
How many acted. Read with attention data, it shows which places turn attention into action.
The rise in interest in your brand after the campaign, from surveys, social listening and direct feedback.
How well the advert suits the place and the platform it plays on.
Every scan, play and answer adds to a picture of who your customers are and how they buy.

Age, gender, location, LSM (living standards measure) and interests.
Sport, travel, cooking, music, comedy, fashion, health and fitness, pop culture, technology and business.
Channels, rewards and loyalty, how often and when they buy, and how likely they are to use a coupon.
Screens with a call to action, reach and frequency, and the app, email, social, web and in-store channels they respond to.
60.5% of engagements came from Friday to Sunday.
An even spread, with an average age of 27 years 6 months.
58.78% chose female or other.
Answers from the guests who took part in the Flying Fish campaign at Tiger's Milk.
Each project says how far it got: results, results to follow, a concept or work in progress.
Guests answered short questions to redeem, and the answers built a profile of who drinks it.

A results dashboard for the Varsity Cup 2025 campaign.

The venue platform behind the dashboards on this page.

Daily sales tracked across the outlets during the campaign.
Hello Brand OS
Where every result is collected and reported.
The campaigns that create the data.
Reporting you can hand to your client.
Tell us what you want to know. We will show you what we can measure, and how.